
| Quick Nav Bar | ||||||||
|---|---|---|---|---|---|---|---|---|
| << Previous | Contents |
Selection |
Op Index |
Parent | User Notes |
Index |
Glossary |
Next >> |
| a=HISTO(GATHER) |
| Items in CAPS are 0/1 switches or switches with more options than 0/1. |
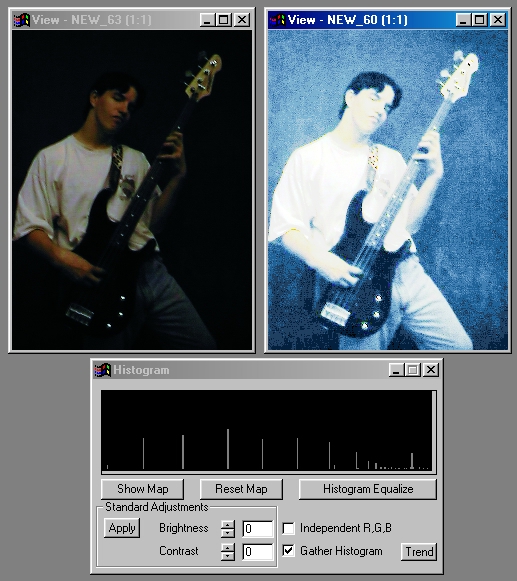
The Histogram operation is used to evaluate, and alter, the statistical data of an image's brightness.
The Histogram will create a graph of the selected area's RGB and Average brightness. These values can then be evenly redistributed or altered in a specific brightness range. This operation also contains the color map for the selected area. This map can be altered to create interesting and new brightness values for each of the RGB components.
The Histogram of the area is obtained by selecting the Gather Histogram option, and then selecting the region to be evaluated. It is important to remember to turn the Gather Histogram control off after you have selected the region to be evaluated. The Histogram graph will display the RGB and Average values for the brightness in the selected area. The graph depicts the amount of a color at a certain brightness level in the selected area. The graph moves from he darkest values on the left to the brightest values on the right.
Once you have the histogram of the selected area you can equalize the distribution of the RGB brightness by selecting the Histogram Equalize option. This redistribution can be applied anywhere in the image that you like.
|
You also have the option of altering only a particular group of brightness values. The group can be windowed by using the Brightness and Contrast controls to enclose the desired brightness values. This group can then be equalized by selecting the Histogram Equalize button, and then pressing the apply button. The next area selection made will then equalize only those brightness values in the selected area.
The Histogram operation also includes the functionality of altering the existing color map. Doing this will cause all of the pixels in the selected region to be remapped to new colors and brightness based on the new color map. The three color components (RGB) can each be altered separately on the same graph. Altering the color map can create new and unusual colors and effects known as solarizations.
Trends
Some of the controls have a Trend button next to them. These trend buttons allow you to set variables over a series of frames. Each frame of any animation may be thought of as a slice of time. The trends allow you to alter some, all, or none of the variables for a particular time slice. Trend graphs have equidistantly spaced vertical lines. For animations under 100 frames in length, each of these lines represents a frame in the animation. The number of frames in any one sequence can be altered using the Sequence controls item from the Timeline pull down menu. Animation lengths of 100 - 999 frames will be represented with a vertical bar being 10 frames, and animation length greater than 1000 frames will have a vertical bar for every 100 frames. Click here to view more information on Trends.
|
Show Map
This button will display the current Color Map in a profile. The Color Map can be used to alter the brightness values for each of the RGB components. The RGB components area altered by simply drawing on the graph using the mouse. The graph will display all three colors when they do not completely overlap. The component is selected by simply clicking on the R, G, or B buttons. There are also six tools to aid in the creation of new color maps. These tools allow you to move the current component graph left, right, up, and down and there are two tools that allow for curve smoothing and enhancement. The color map can be applied to an image at any time by selecting an area in an image. Alterations to the color map can create new and unexpected colors in the selected area.
Reset Map
This will reset the current color map to the default map. Applying the default color map to the image will have no effect.
Histogram Equalize
This button, when pressed, will reorganize the image brightness values so that they are statistically evenly distributed through out the available color range. This operation can be done for the whole range of brightness or for a group. A group of brightness values are equalized by windowing the brightness values using the brightness and contrast controls, pressing the Histogram Equalize button, and then pressing the Apply button. Doing this will apply a histogram equalization that occurs over only the selected brightness levels. It is important to remember that histogram equalization will almost always lose some image information, but the overall effect can be quite pleasing.
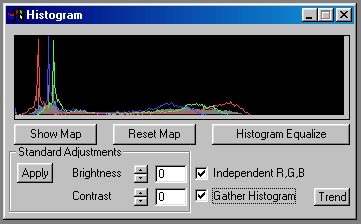
Independent RGB
This control, when selected, will display the average histogram and the individual RGB components. If this control is not selected, then only the average brightness values will be displayed.
Apply
This control will apply the current Brightness and Contrast window to the color map. A window can be directly applied or it could be histogram equalized first. A direct application allows you to dynamically stretch the selected brightness range over the entire range of available brightness values.
Brightness and Contrast
The Brightness and Contrast control allow you to window a range of brightness values. The Brightness control will move the position of the window, and the Contrast will alter the number of brightness values in the range. Increasing the brightness will move the window position to the left, and decreasing the value will move the window to the right. Increasing the contrast value will decrease the number of brightness values in the window, and decreasing the contrast will increase the number of brightness values. Once the window has been specified you can then histogram equalize the window or directly apply it to the color map. These controls are set by either using the slide gadgets or by entering the appropriate brightness and contrast values in the text entry fields.
Gather Histogram
This button, when selected, will gather and create a histogram based on the image information in the selected area. This information can then be equalized or altered to create new brightness values for the pixels in the next area select. It is important to remember to turn this control off once you have the histogram from the specified region. The current histogram will be lost when another gather operation is performed.
| Quick Nav Bar | ||||||||
|---|---|---|---|---|---|---|---|---|
| << Previous | Contents |
Selection |
Op Index |
Parent | User Notes |
Index |
Glossary |
Next >> |
| WinImages F/x Manual Version 7, Revision 5, Level B |